Dynamometer Software
The brain of V-tech's dynamometers is DynaVTECH - proprietary dynamometer control software using our patented TrueForce II technology.
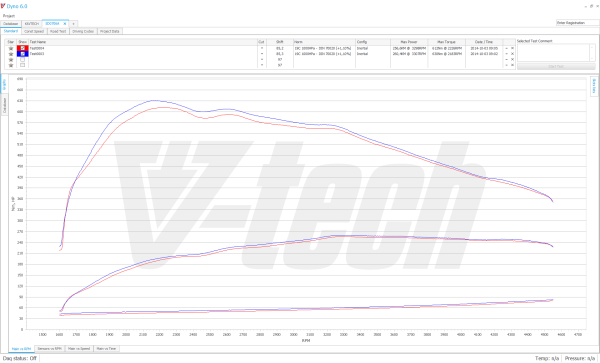
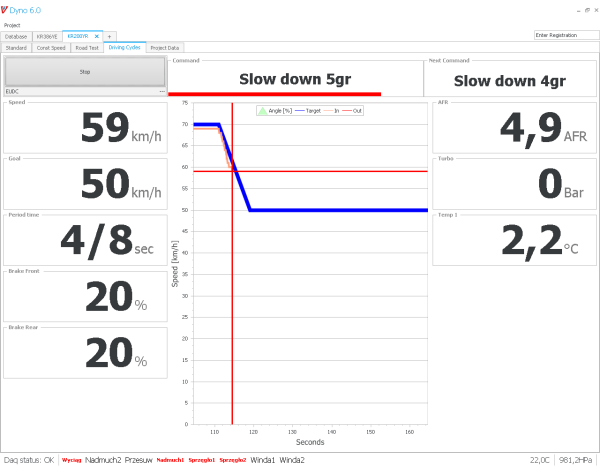
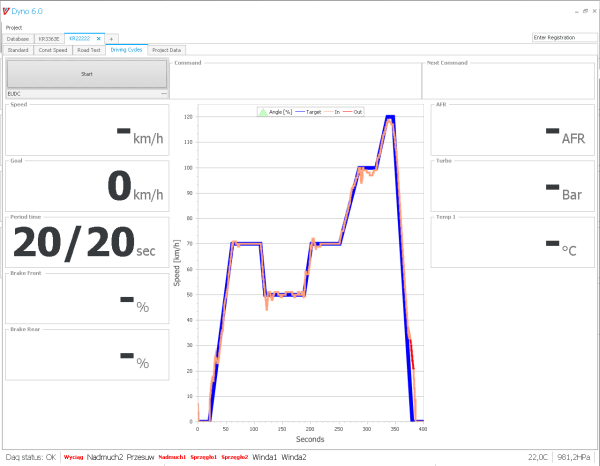
With DynaVTECH, you have full control over all the measurement functions of the device. In addition to classic measurements of engine power, torque and speed in inertial or braked mode, DynaVTECH offers many additional, advanced measurement modes, such as power measurement at steady state mode or simulation of road conditions. Our software also gives you the possibility to log and analyse data from external sensors, CAN, OBD II, probes, etc.
The main advantages of DynaVTECH are:
- As the VtechDyno dynamometer is modular, our software expands for free, providing new functions as your dynamometer grows,
- measurements of power and torque in both inertial and braked mode,
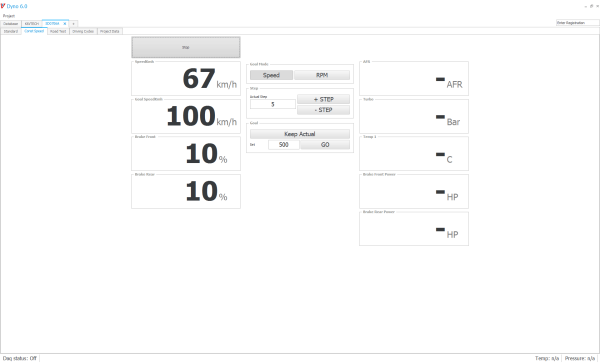
- steady-state mode – power measurement at user-specified rpm of the engine,
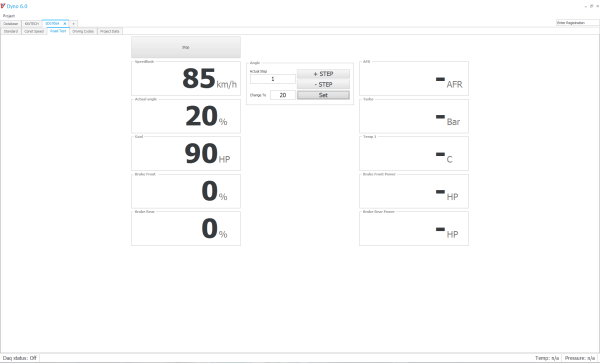
- simulation of road conditions (friction, air resistance, etc.) simulation of slopes (dynamometer with brakes only)
- logging of information from sensors and probes during the measurement (boost pressure, AFR, temperature sensors, etc.)
- on-screen presentation during measurement: rpm, the linear speed of the vehicle, probe temperatures (e.g. oil temperature), mixture composition (AFT), boost pressure
- logging and visualisation of results from up to 14 analogue sensors + OBD2/CAN sensors
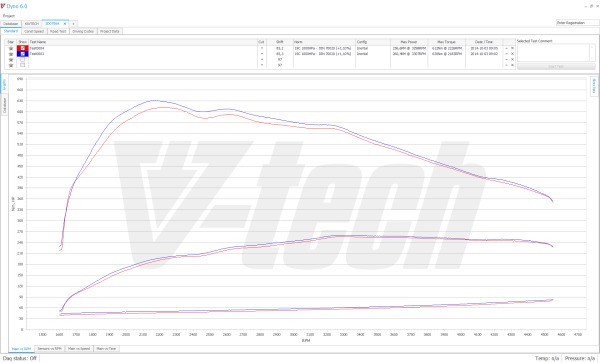
- graphical and numerical presentation of results (engine power and torque, power and torque on wheels, losses, vehicle speed, results from external sensors and probes)
- registration of temperature and external pressure,
- results conversion according to the standards: DIN70020, EWG 80/1269, ISO 1585, JIS D 1001, SAE J 1349,
- possibility of simultaneous display and analysis of up to 4 measurements,
- precise zoom allowing an evaluation of regions of interest in the plot,
- presentation of results in any units (kW, PS, HP, etc.)
- export of results into formats: Excel, JPG, PNG, WMF, BMP,
- a concise presentation of measurement results on A4 colour print,
- presentation of client address and logo on the printout,
- possibility of writing the results of tests into a program database for further analysis,
- wireless control of the dynamometer and air fans.
facebook
